What is a Sustainability Report Card?
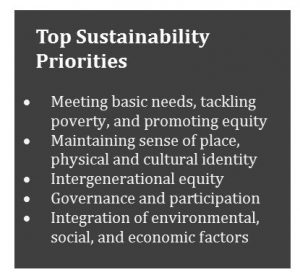
A sustainability report card is a check-up on the well-being of a community or region based on a common vision for the future. This Report Card is a snapshot in time of the former Clarenville-Bonavista Rural Secretariat region, which includes three distinct regions: the Isthmus of Avalon, the Clarenville area, and the Bonavista region. This Report Card is meant to lead to strategic planning and collaboration across communities to take action on these findings. The top identified priorities for regional sustainability are shown to the right.
How We Measure Progress
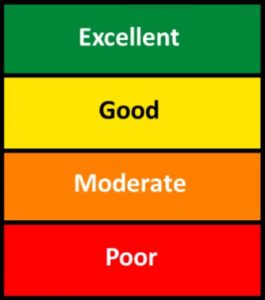
Image credit: Telos Brabant Centre for Sustainable Development, Netherlands. Benchmarks adapted from methods developed by Telos.
In this Report Card, we use 22 indicators shaped by a two-year public engagement process to show how well the region is doing in achieving its sustainability vision. We have rated each of these indicators on a scale shown below, using both public perspectives and data from a wide range of sources. Each indicator has benchmarks, including a target for how much we hope it will improve, and a limit that warns us that we need to work harder to improve it. Recent trends are shown by arrows. The figure to the left shows the scale we have used to evaluate the region’s indicators, ranging from excellent (green) to poor (red). Below are images showing how we are doing in each of the region’s five sustainability priority areas.
How is the Region Doing?
Overall, the Clarenville-Bonavista-Isthmus region is doing relatively well at meeting the regional sustainability priorities listed that community members have identified. The Report Card’s findings, based on the assessment of the region’s sustainability indicators, show a number of key successes and challenges facing communities in the region.
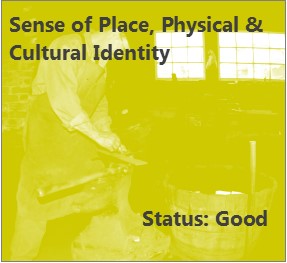
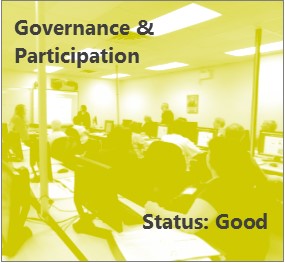
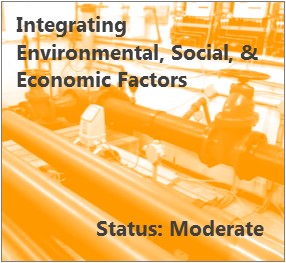
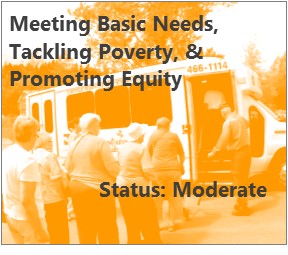
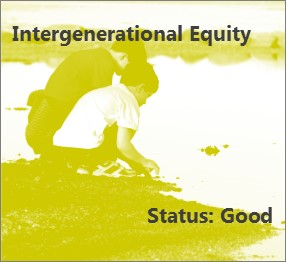
These findings are explained in detail in the pages for each of the 5 sustainability priorities for the region. As shown in the graph below and in the images to the right, the region is ranked as Good for three priority areas, but is Moderate in the other two, highlighting that we need to work together to advance strategies to improve key issues and ensure greater support for local efforts.
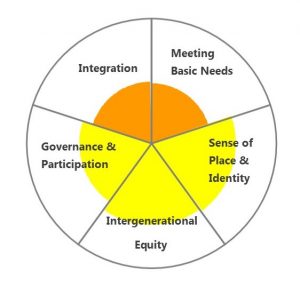
Overall Sustainability Progress of the Region.